


The Center for Responsive Politics (CRP) recently released their final tally of spending in the 2016 election cycle. Here are 5 takeaways:
Despite hyperbolic predictions, “dark money” was nearly non-existent in 2016.
As CCP has long explained, the amount of political spending by nonprofit groups that aren’t required to report the private information of their supporters to the government (so-called “dark money”) has long been exaggerated. In their analysis, CRP tacitly confirms that this is even more true now than it ever has been. “Dark money” accounted for just 2.9% of total 2016 spending – the lowest percentage since the term was invented.
Nonprofit groups, in total, spent $183.8 million during the entirety of the 2015-2016 cycle. That is less than the total spent by either the Democratic National Committee ($216.7 million) or the Republican National Committee ($255.6 million). Candidates spent over 16 times as much money as these groups.
Keep in mind, this $183.8 million represents total spending by all nonprofit groups in the primaries and general election across the country. This figure also overstates the actual impact in terms of number of ads aired, since candidates have the privilege of buying ads at a cheaper rate than independent groups.
The next time you hear that “dark money” is flooding our political system and “destroying our democracy,” it’s probably worth asking yourself how such a relatively small amount of money is accomplishing this feat.
In the election cycles following Citizens United, total spending has been decreasing.
This likely comes as a surprise to anyone who has read any media account about money in politics lately, but total campaign spending has not been skyrocketing in the years following the 2010 Supreme Court decision that freed independent voices to speak about candidates. Total 2016 spending clocked in at $6.44 billion (unconventionally rounded up to $6.5 billion in the media). When adjusted for inflation, that is less total spending than in 2012 ($6.59 billion in 2016 dollars). As CRP notes, inflation-adjusted spending also fell from 2010 to 2014.
In an atmosphere where commentators and media reports regularly trumpet each successive election as the most expensive ever, some perspective is important. Campaign spending has plateaued, and 2016, by most reasonable metrics, was not the most expensive election in history. Of course, all recent elections pale in comparison to 1896.
The media’s influence far outstrips all campaign spending.
Political spending primarily goes toward political speech. But, as CRP notes, the value of that speech is overshadowed by political speech from the media: “But Trump was Trump, and thus a constant focus of media attention. According to mediaQuant, Inc., from July 2015 through October 2016 Trump received free media worth more than $5.9 billion. Clinton received less than half that figure, a little under $2.8 billion. That helped negate the fact that Clinton and her supporters massively outspent Trump and his.”
The implication of this, however, is not simply that Trump had a massive media advantage, but that spending on campaign speech always pales in comparison to the value of media coverage. Trump received an astounding $14 worth of media coverage for every $1 spent by his campaign or groups supporting him. But Clinton was also outgunned by the media. For every dollar spent in support of Clinton, $3.60 was “spent” discussing her on TV and in print.
The influence of super PACs is overstated.
Independent expenditure-only PACs, colloquially referred to in the media as “super PACs”, have undoubtedly been the biggest innovation in the world of campaign finance since 2010, and spending by these groups has been increasing over this time. Nonetheless, their influence has been regularly overstated. Super PACs accounted for 19.4% of all campaign spending in 2016.[1] Super PACs were outspent by political party committees, which accounted for 24.3% of all campaign spending. Further, candidates spent $2.40 for every dollar of spending by super PACs. And remember, candidate spending buys more ads.
Super PAC spending on congressional races was almost identical across parties.
It is often assumed that super PACs disproportionately benefit Republican candidates over Democratic ones. In 2016 congressional and senate races, this was not the case. Super PACs supporting Republican congressional candidates spent $408 million, while those supporting Democratic congressional candidates spent $379 million. These totals represent 6.3% and 5.9% of total campaign spending for the cycle, respectively.
The margin in the presidential election was larger, mostly due to the 17 candidates, many with strong financial backing, that ran in the Republican primary. But, at least in 2016, there did appear to be super PAC support across the political spectrum. For every Tom Steyer, there is a Sheldon Adelson, and when a group on one side of an issue buys political ads, there is reliably a group on the other side of the issue that does likewise.
Ultimately, voters get to hear both sides before they cast their vote. Far from destroying democracy, that is democracy.
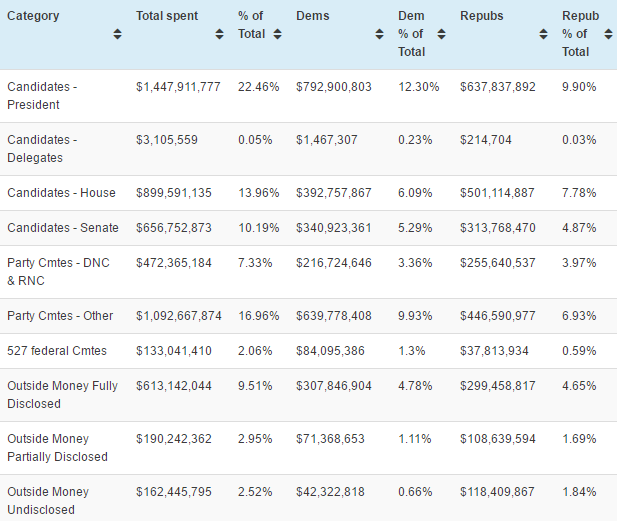
Below is the complete breakdown of 2016 spending by category taken from CRP’s data, along with the percentage of total spending that each category represents. (Third party spending has been omitted.)
[table id=4 /]
[1] To calculate this figure, we combined the categories “Outside Money Fully Disclosed” and “Outside Money Partially Disclosed” for both the Congressional and Presidential races, available here.