


Understanding election spending can be difficult. Complex campaign finance laws and numerous categories of political giving and spending are enough to make your eyes glaze over. If that’s the case for experts, reporters, and analysts working in the field, it is certainly even more incomprehensible to the average voter who has less time and know-how to fully dig into the numbers. The job becomes that much harder when watchdog organizations opt to build convenient narratives by peddling false conclusions.
This is the case with the Center for Responsive Politics’ (CRP), also known as OpenSecrets, analysis of a new report that it conducted jointly with the Wesleyan Media Project. The CRP headline reads, “TV ads in midterms up nearly 90 percent fueled by nondisclosing groups.”[1] This is not just misleading, but false, as can be plainly seen in the report itself.
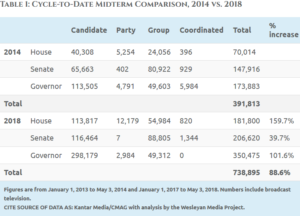
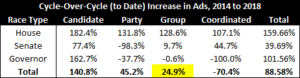
The report’s data show that, while the number of all political and issue ads aired on TV increased from the 2014 to 2018 election cycles[2] by 89%, much of that increase was not driven by “group” ads (the category sometimes called “outside groups” that includes ads by groups that do not disclose their donors). In fact, “group” ads as a proportion of the total fell from 2014 to 2018, from roughly 40% to 26% of the total. The proportion of ads from candidates, by contrast, rose from 56% to 71.5%. This is quite clearly what is most driving the increase in ads. The relevant table from the CRP-Wesleyan Media Project report is copied below, along with additional analysis based on those figures.[3] (The report did not include a table that compares the amount of spending for all races in 2014 and 2018, so the analysis is based on number of ads, itself a problematic method of measurement.)
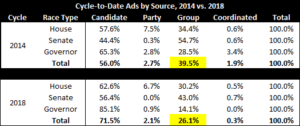
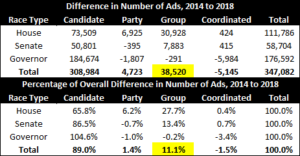
Now that we see that “outside” or “group” ads are a relatively small (and shrinking) proportion of political ads in 2018 compared to 2014, let’s turn to the central “shock” statistic of CRP’s analysis: CRP’s claim that “a majority of the ads bought by outside groups targeting House and Senate races were run by ‘dark money’ groups, which don’t disclose any of their donors.” (According to CRP, these figures are 67.7% for House races and 57.6% for Senate races.) This claim describes a fraction of a fraction of a fraction. Ads from groups that don’t disclose their donors are just a subset of ads from outside groups; ads from outside groups are just a subset of ads from all sources (26.1% in 2018 to be precise); and all of these ads are just a fraction of the total political ads that will be run in 2018. By Election Day, you can expect the number of ads to have skyrocketed and, perhaps, the proportion of 2018 spending coming from “outside groups” (including non-disclosing groups) to plummet.
Look to the 2014 midterms as an example. The CRP-Wesleyan report claims that almost 40% of cycle-to-date ads in 2014 came from outside “groups.” Yet for 2013-2014 overall, only 4.6% of total spending came from nonprofits that don’t disclose their donors (so-called “dark money”). Looking at CRP data for all outside groups (excluding party committees and including groups, like super PACs, that do disclose their donors), we find that there was $85.5 million in spending for the 2014 cycle-to-date,[4] which is 15.1% of the $567 million in total spending for the entire cycle. The amount of ad spending increased almost sevenfold. In short, the share of ads from non-disclosing groups will be completely different – and probably much lower – in several months’ time. Even if the current breakdown of ads from non-disclosing groups holds for the cycle as a whole – 67.7% of “group” House ads and 57.6% of “group” Senate ads – this means the total number of ads from non-disclosing groups would only account for 12% of all ads.
Of course, it is impossible to predict what final ad spending numbers will look like after Election Day. But besides looking at trends from previous years, our previous analyses of CRP and Wesleyan studies also give reason for pause. We have taken issue with their methodology that may overstate so-called “dark money” spending – comparing the number of ads each year rather than focusing on the overall context of political spending is one such flawed maneuver that we see repeated in this study much like in previous ones.
It’s worth noting further that an increased number of political ads is not the calamity that some may think. Political ads increase pretty much every year as the number of media platforms and number of voters to reach grows. Even if the proportion of ads from non-disclosing groups increases, that’s not a problem. Nonprofit groups are not required to disclose their donors because tax rules limit their ability to influence elections – their “primary purpose” may not be influencing elections. Given the numerous limitations on their ability to influence politics, it does not make sense to compromise the privacy of nonprofit donors by posting their names, addresses, occupations, and employers on the Internet. Such disclosure could subject citizens to harassment or threats of reprisal for simply exercising their First Amendment rights and further provide a misleading representation of what communications a particular individual supports. Citizens donate to nonprofit groups because they support the organization’s overall mission, not necessarily particular communications or even every position taken by the organization. In spite of all this, it’s not unreasonable to suggest that there should be avenues for private political participation.
Groups like CRP may disagree with this view as a matter of policy. But it is one thing to make a case that more ads from non-disclosing groups is a bad thing – it is quite another to falsely claim that such groups are “driving” the increase in ads. The facts of CRP’s own report clearly show otherwise, and yet their analysis does not come with the title “candidates are (still) the biggest campaign spenders.” CRP’s inability to state what the data plainly says does a disservice to those it is trying to better inform with its analysis of political spending.
[1] CRP includes some data from super PACs in its “no disclosure” category, despite the fact that super PACs are legally required to publicly report their donors. According to CRP, super PACs are included if “95 percent or more of the donations it has reported came from a nondisclosing group, like a 501(c).” This means some of those donations do not come from non-disclosing sources, and that the non-disclosing donors do not have direct control over the use of the funds from their contribution. See: “Outside Spending by Disclosure, Excluding Party Committees,” Center for Responsive Politics. Retrieved on May 16, 2018. Available at: https://www.opensecrets.org/outsidespending/disclosure.php (May 15, 2018).
[2] The report compares ads run from January 1, 2013 to May 3, 2014 and January 1, 2017 to May 3, 2018. This is the “cycle-to-date” at the time of the report, rather than the total for either cycle.
[3] Some rows in the tables do not add up to 100.0% because of rounding.
[4] As of May 10, 2014. This data was retrieved May 10, 2018.